Boxplot
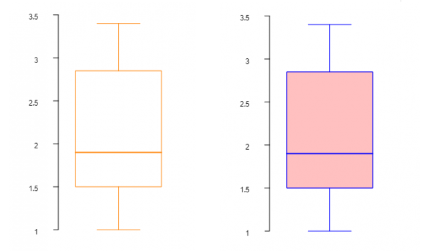
Boxplots are very useful for a concise representation of a data set. In one boxplot, we see the median, the interquartile range (IQR), as well as outliers.
Syntax
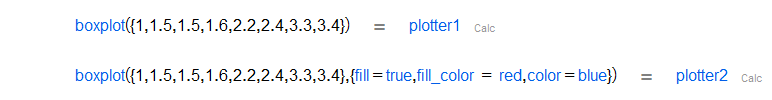
boxplot(Statistics_data)
Description
It draws a boxplot for a data sample.
 |
|
Options
Option | Description | Format | Default value |
|---|---|---|---|
box_width | Specifies the width of all boxes. | Positive Float. |
|
color | Specifies the color of the outline of all boxes. | RGB list of values | |
data_subset | A list specifying which positions (indexing begins at 1) of the list of values in | List of positive integers. | |
fill | When set to true, | Boolean. | |
fill_color | Set the color to be used in the interior of all boxes (if | Color value following the format described in the | |
group | Assigns a group to each data value, according to position in the list. An element in | List of Strings, exactly as long as the length of | |
labels | Provides labels for each group of data, written under (or to the side of) each box in the plot. If the | A list of Strings. | |
notch | When set to true, boxes are notched at the median of the box. The notch extends to a 95% confidence interval. | Boolean. | |
orientation | Plot boxes either horizontally or vertically. | | |
show_outliers | When set to true, outliers are plotted as points. If false, outliers are not plotted. | Boolean. | |
title | Displays a title above the boxplot. | String. | |
whiskers_range | Adjusts the maximum length for which data can be shown as a whisker. If the largest value is under Q3 + whisker_range*IQR, it is plotted as a whisker. Similarly the smallest value above Q1 - whisker_range*IQR will be plotted as a whisker. Values outside of the whisker range are considered to be outliers. | Non-negative Float. |
|