Bar chart
As opposed to histograms, bar charts are helpful for displaying discrete data, as well as categorical data.
Syntax
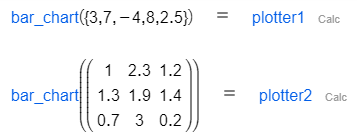
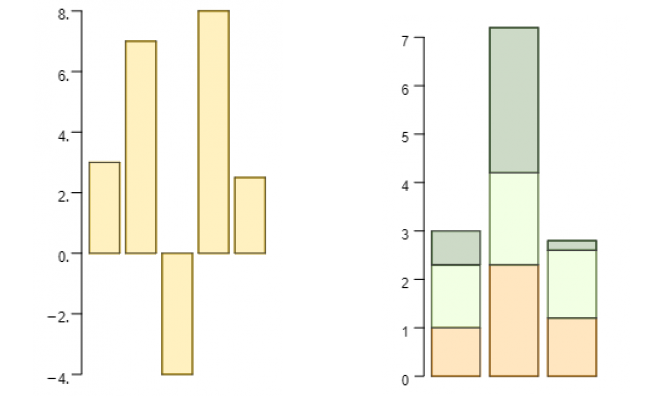
bar_chart(Statistics_data)
Description
It draws a bar chart for a data sample.
 |  |
Options
Option | Description | Format | Default value |
|---|---|---|---|
bar_width | Specifies the width of bars to be used. If bars are stacked, it changes the width of the stacks, and if they are juxtaposed, then the total width of each juxtaposed set of bars is affected. If | Positive Float. |
|
beside | Only used when data is a matrix or list of lists. If set to true, bars will be juxtaposed. If false, bars are stacked. | Boolean. | |
color | Sets the color for the borders of the bars. | RGB list of values | |
fill_color | Sets the color for the interior of the bars. For bar charts with a vector argument (single bars), consequent bars are colored according to the list order and wrapped around if fewer colors than bars are provided. For matrix arguments, the list specifies the order in which bars in a single stack or set of juxtaposed bars is colored (with the same wrap-around behaviour). | A list of colors | |
labels | Each element in the list makes a label appear below the corresponding (set of) bars. If fewer labels than bars are provided, then bars after the last label remain unlabeled. | A list of Strings | |
log_scale | When set to true, a logarithmic scale is used for the y-values of the chart. | Boolean. | |
orientation | When set to vertical, bars are placed vertically. When set to horizontal, bars are placed horizontally. | | |
show_axis | When set to true, the y-axis is shown on the graph if bars are plotted vertically. If bars are plotted horizontally, then the x-axis will be shown. If false, no axes are shown. | Boolean. | |
space_between_bars | Specifies the horizontal or vertical distance between bars (measured on the axes; scaling will adjust how much distance is actually seen, so we may need to adjust axes limits accordingly). | Positive Float |
|
title | Displays a title above the graph. | String | |
x_limits | List of two numbers to be used as the minimum and maximum values displayed on the x-axis. | Two Floats | |