Represent
Draws an object and shows its relevant information.
Syntax
represent(Object)
Description
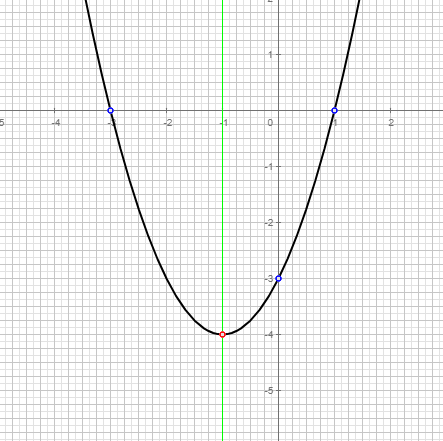
Functions are represented by plotting the graph and features of interest such as individual points, asymptotes and local maximum values. It is defined for objects of type: Function, Circumference and Conic.
 |
|
Options
Option | Description | Format | Default value |
|---|---|---|---|
asymptote | We can choose the color and line width of the asymptotes if such exist. | | |
border | We can choose if the border of closed figures is painted or not. | | |
color | We can choose the color to be used for drawing. RGB list of values | | |
curve | We can choose the color and line width of the function's representation. | | |
fill | In the case of a closed figure, the command determines whether the interior is filled or not. | | |
fill_color | If working with a closed figure and if the value defined for | | |
inflection_point | We can choose the color and size of the inflexion points if such exists. | | |
intersection_axis | We can choose the color and size of the intersection points with the axis if such exists. | | |
intersection_x_axis | We can choose the color and size of the intersection points with the x-axis if such exists. | | |
intersection_y_axis | We can choose the color and size of the intersection point with the y-axis if such exist. | | |
line_width | This command is used to set the thickness of lines, segments or functions drawn on the drawing board. | | |
singular_point | We can choose the color and size of the singular points if such exists. | | |
symmetry_axis | We can choose the color and line width of the symmetry axis if such exist. | | |