Plot
Draws an object.
Syntax
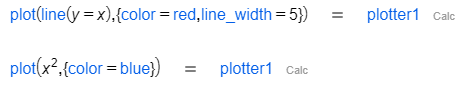
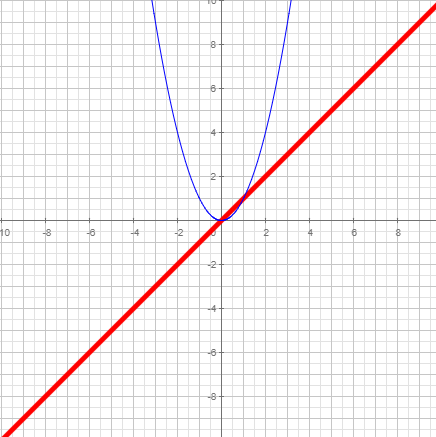
plot(Object)
Description
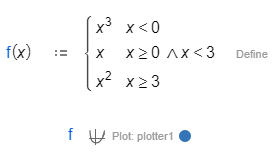
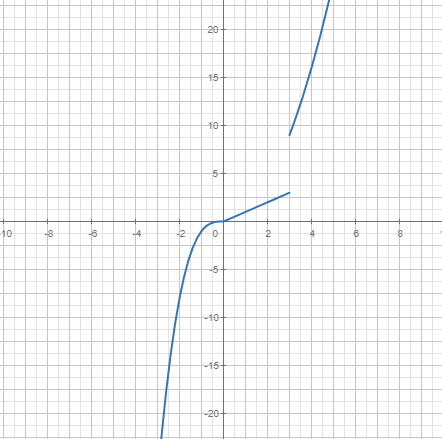
Plots an object. Some objects that can be drawn include circumferences, curves, equations, expressions, functions, lines, points, polygons, polygonal, segments, text boxes, and triangles. If the argument is a list, all its elements are drawn.
 |
|
 |
|
 |
|
Options
Option | Description | Format | Default value |
|---|---|---|---|
border | We can choose if the border of closed figures is painted or not | | |
color | We can choose the color to be used for drawing. RGB list of values | | |
fill | In the case of a closed figure, the command determines whether the interior is filled or not. | | |
fill_color | If working with a closed figure and if the value defined for | | |
fixed_dimensions | This defines whether or not objects must be repositioned in the plane when the drawing board dimensions are changed. | | |
line_width | This command is used to set the thickness of lines, segments or functions drawn on the drawing board. | | |
visible | This command determines whether the element is visible or not. | | |