Basic Guide - Wiris CAS
Caution
Until now, Wiris CAS was the tool for writing the algorithms in WirisQuizzes Studio Now, as a beta version, you can try CalcMe our cross-browser compatible Javascript calculator, within WirisQuizzes. Find out how here.
On this page, you will know the basics of Wiris CAS We will explore random number generation, polynomials and general expressions, and how vectors and matrices work. Some helpful tips about lists comprehension will be given before some basics about geometry features are shown. We will visit some statistical functions, user functions and programming commands. Finally, a detailed explanation of the graphics is given.
Randomness
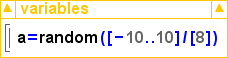
The random function in WirisQuizzes is adaptable to many use cases. For example, we'll show you how to remove the "0" from a random selection. The standard command would be something like:
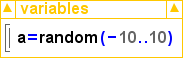
By default, this includes all of the numbers between -10 and 10. If the number 0 supposes some sort of difficulty or wrong behaviour for our question, we can remove it with the simple instruction:
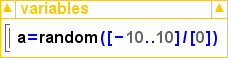
We have to add brackets around the first list for this to work. As you may suspect, this can work for any other number we use instead of zero:
The above would produce a random number between -10 and 10, except the number 8. Or you can even do this with more than one number:
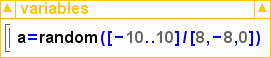
This would remove 8,-8, and 0 from the selection. As can be seen, we have many more options than it seems at first when creating a random variable.
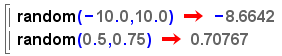
So far, we have retrieved integer numbers. We can also obtain real numbers.
Polynomials and expressions
Polynomials are created with numbers times a power of a variable.
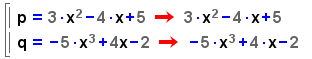
We can sum, multiply, divide and, for instance, find roots of polynomials.
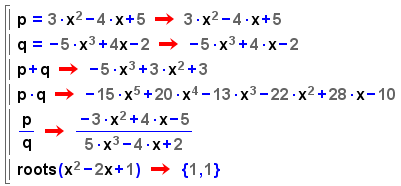
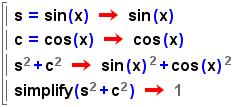
We can create more complex expressions and operate with them.
Vector and Matrix constructor
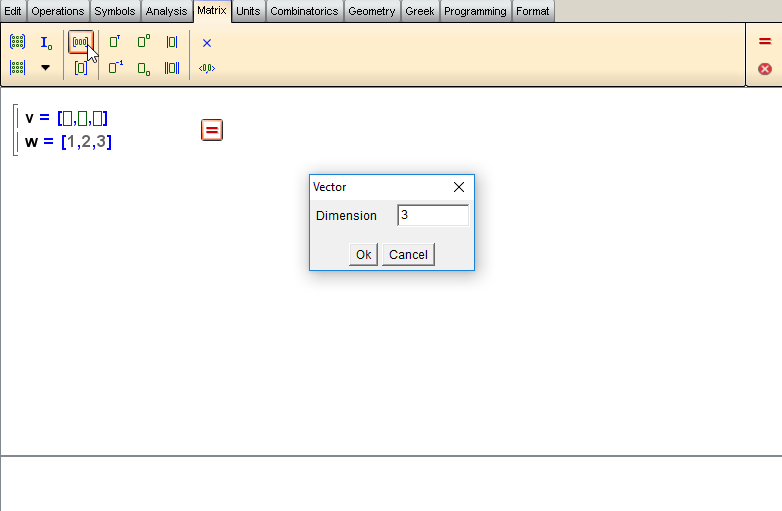
Vectors
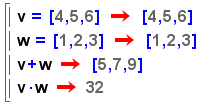
Vectors are constructed with square brackets [], and commas , separate the elements.
We can sum vectors or compute the scalar product between them.
Matrices
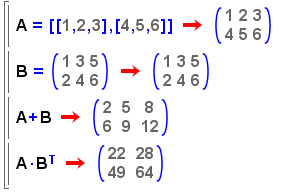
Matrices are vectors of vectors, that is, vectors whose rows are vectors. We can create matrices with two different syntaxes.
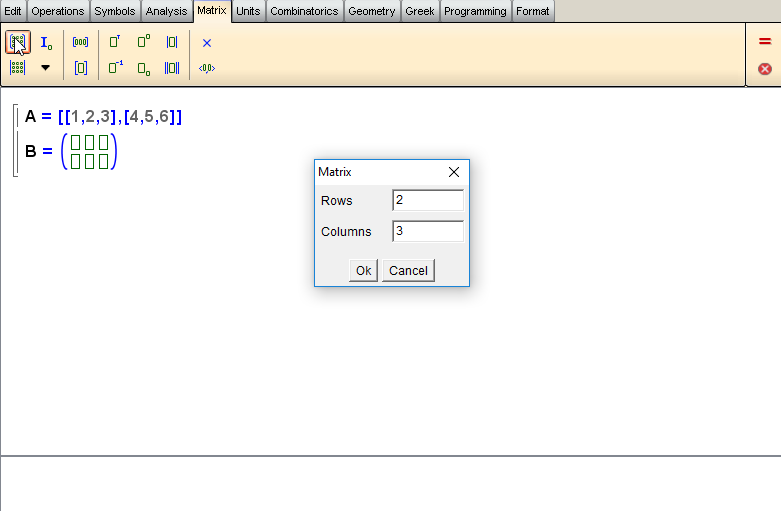
As vectors, we can sum and multiply matrices (as long as dimensions match).
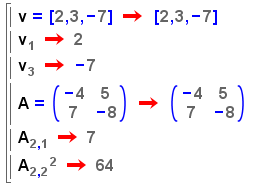
Element access
We can access a specific a vector element using subindices that start on 1. In the same way, we can retrieve an element of a matrix.
Creating lists via comprehension
This section is a short guide to creating lists in WirisQuizzes algorithms, using the commands with and where. This method of defining lists is based on the standard mathematical notation of "set comprehension" or "set-builder notation", for instance:
We'll explain the commands through the following examples.
Example 1
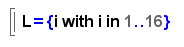
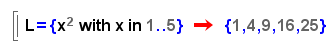
At the most basic level, with provides a more compact form of writing long lists. We could write
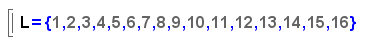
or we could greatly simplify it to the following:
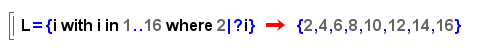
The command where comes in when we want additional restrictions. To get only the even numbers, for example:
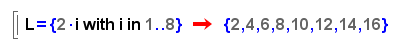
Alternatively, we could, of course, have gone with:
Example 2
In the first example, the size of the list was fixed. However, comprehension shows its most benefit when defining variable-length lists. Here, for example, is a list with random elements of random size.
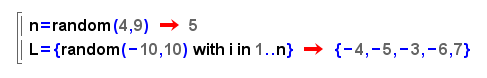
As you may notice, the first expression need not explicitly depend on . We can think of as just a counter within a specified range. Then, we may or may not use it to define the list elements. It can also be any variable name we choose, as in the following:
Example 3
The list comprehension notation can also be extended to more than one variable. In that case, we must specify the range for each variable used as a counter. For example, here is a list with all positive proper fractions in simplest terms, with a single-digit numerator and denominator:
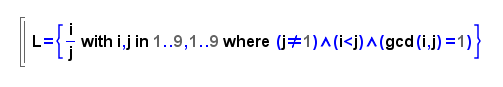
Another recommendation illustrated in the above is to enclose each condition after where in parentheses, if we have more than one joined by .
Example 4
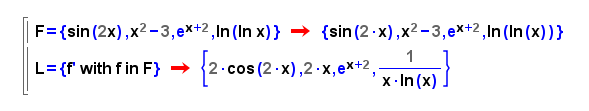
Finally, we note that the range for the counter variable can itself be a list, defined previously.
Example 5
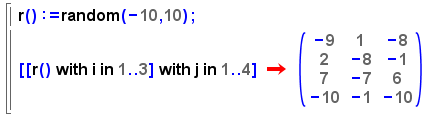
It is also possible to create matrices using this notation. For instance, creating a matrix with random coefficients is as simple as this:
Geometry
Wiris CAS allows us to deal with geometrical figures such as points, lines, planes and conic sections.
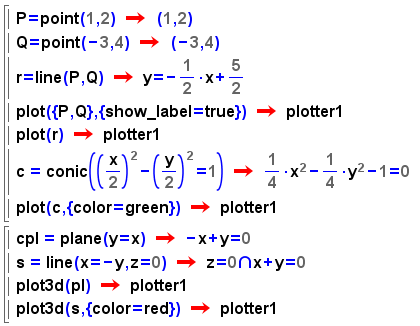
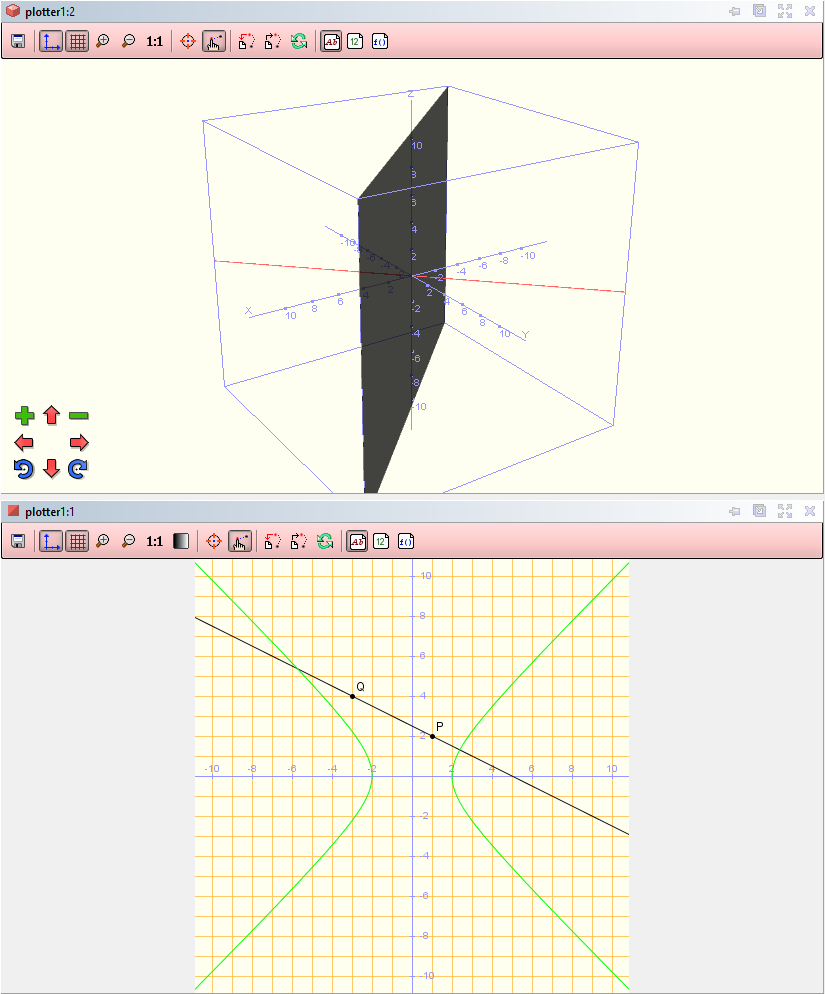
We can also create polygons and polyhedras, both in 2D and 3D.
We can also compute the distance between figures, the angle they form and compute the symmetry.
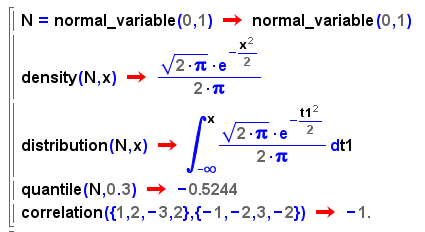
Statistics
There are a lot of functions involving statistical functions, like mean, quantile, quartile... You can see a complete list here.
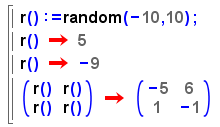
User functions
We can create our own functions. As you can imagine, the random command is handy, but it could be a bit tedious to write every time random(-10,10), for instance. Instead, we can create a function that generates a random number when called:
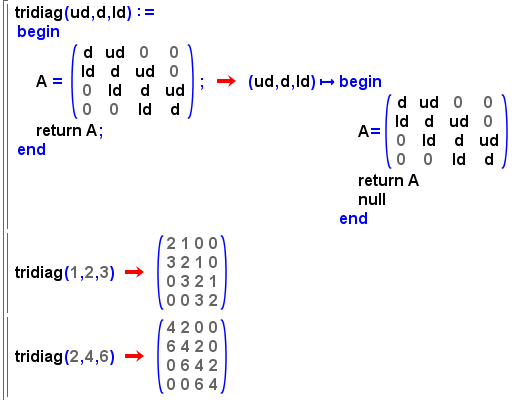
This way is straightforward, creating a matrix with random coefficients. Another more elaborated example is creating a function that constructs a tri-diagonal matrix given three numbers. Therefore, every time we want to create a tri-diagonal matrix, we need to call this function with the terms of the upper-diagonal, diagonal and lower-diagonal.
Programming
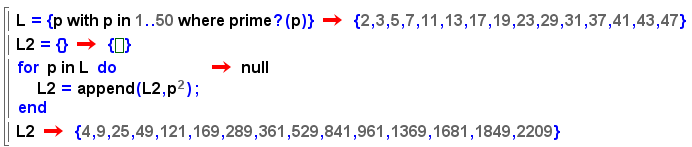
We can use some programming functions. You can see the basic ones here. For instance, by creating a list as before, we can efficiently compute the square of the first primes.
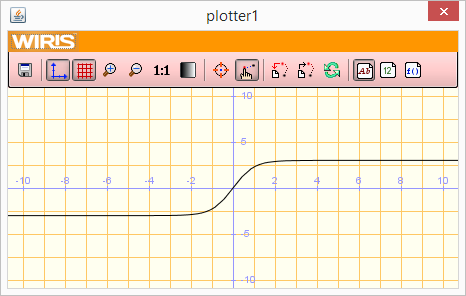
Plotter
WIRIS graphics live within a plotter. When this plotter is interactive, you have a toolbar that lets you change some of its configuration; centre, zoom, show axes, etc...
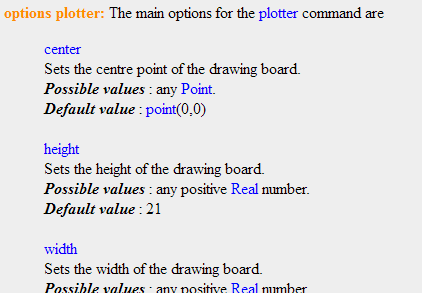
You can also change all the settings using commands. The available options are listed in the Manual (plotter).
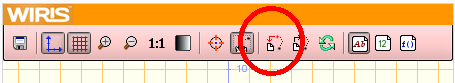
You can first change options interactively, then get the equivalent commands using the button Save plotter movements.
One must distinguish between the general plotter options and each graphic object's particular options that live in it. The possibilities of objects are set using plot() and are also listed in the Manual (plot).
Here we'll discuss only the general plotter options, not the objects.
Create and use
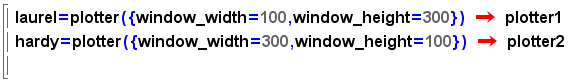
You can create new plotters using the command plotter(). Each plotter has its individual configuration. The created plotters have sequential automatic names: plotter1, plotter2, plotter3 ... but can be assigned to a variable to use another name. When a plotter is completed, the command returns its name.
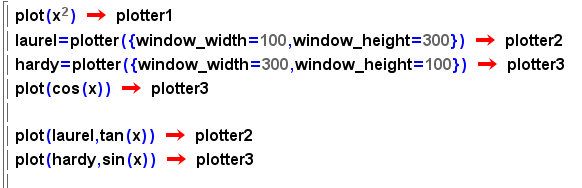
You can set the plot to use in the command plot(). If not specified, then it will use the last created plotter. If there is no plotter yet, a new one will be made with default options. The command returns the name of the used plotter.
The command represents () behaves like plot(), but when you create a new plotter, then it automatically changes some options. If you don't want this behaviour, then modify the options of plotter1 after.
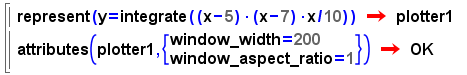
Plotter options can be set at the time of plotter creation by using the command plotter()or later by using the command attributes(). These options can be written as a vertical list using the key combination Shift + Enter.
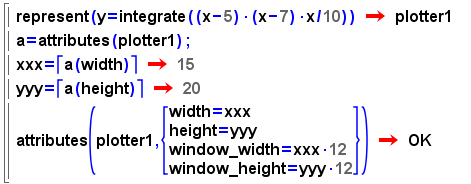
Plotter options are of Table data type so that they can be manipulated as usual. You can get the possibilities of an already created plotter by using the command attributes() and assigning them to a variable. For example, one can access a value using parentheses.
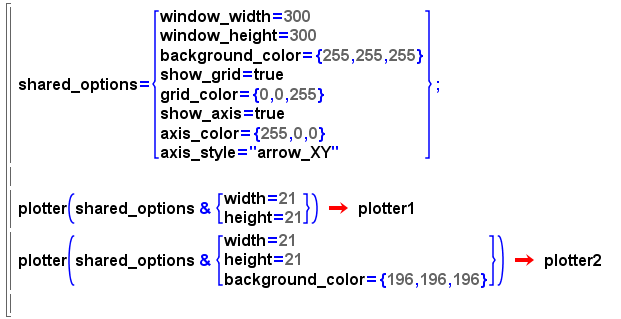
Another example: you can combine multiple lists of options using the &.
Size
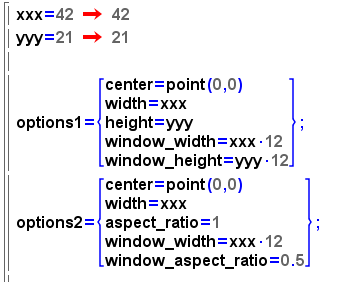
The dimensions of the displayed area can be set in two ways:
Giving both width and height
Or giving only one, and aspect_ratio.
The dimensions of the window can also be set in the same way.
Grid
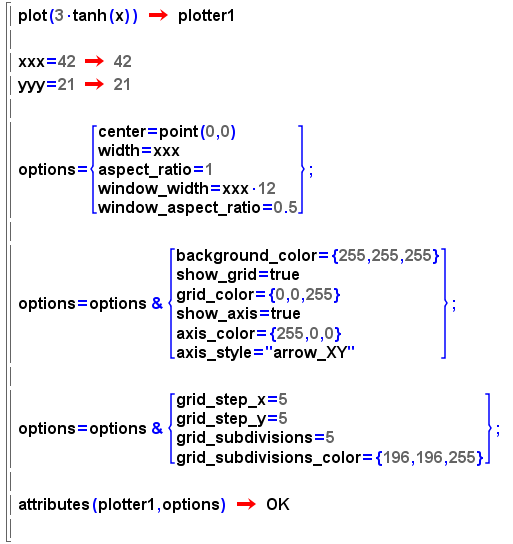
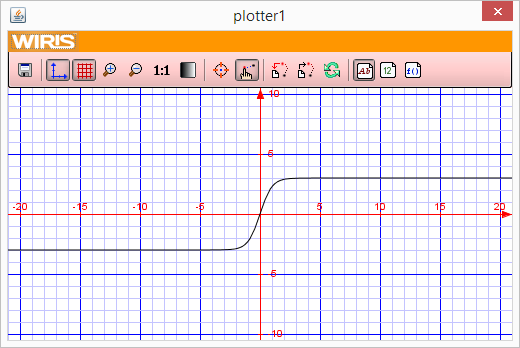
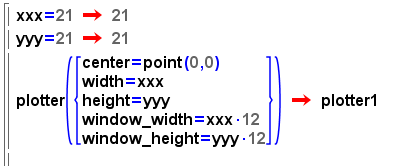
The grid density is automatic and depends on the dimensions of the window and the displayed area. For example, to get a grid of 1 unit, the window_width must be between 12 and 24 times the width.
In recent versions of WIRIS, there are commands for controlling the density of the grid. And in addition to the primary grid, you can use a sub-grid.
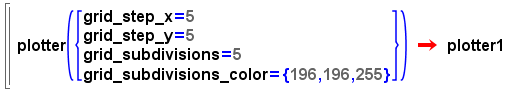
See this complete example: